Tuesday, December 31, 2019
REBGV 2019 Review
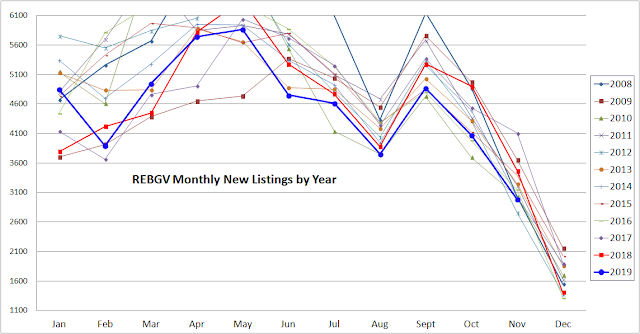
Yearly New Listings hit some significant low this year and is by far the story of 2019 in REBGV. This had a direct impact on negative total inventory change year-over-year. This is now 3 consecutive years of New Listings decrease on a yearly basis. As you can see, this is not a common occurrence. It should rebound next year but it's not clear to what extent.
Annual sales beat out last year's low and finished ahead of 2008, 2012 and 2018 during the recent times. It is widely expected that sales will increase next year given the recent rise in sales and SAL ratio during the latter half of 2019.
Year-end total inventory dropped year-over-year which is a surprise given how 2019 started in the beginning. It took a turn during the summer and continued to drop during the latter half of the year. With both sales and new listings expected to be higher in 2020 compared to 2019, it will be interesting to see which direction TI will go.
Thursday, December 5, 2019
REBGV November, 2019: Sales
Sales remained strong through November keeping the monthly sales above the 10-year average for 2 months in a row. Is this just a result of falling prices? Not too long ago, we had some incredibly low sales during March and April of 2019. The price difference between now and then among different housing types are 0-2%. Thus, it doesn't appear that falling prices are exactly responsible for this. If so, then what are we to expect if the interest rate is to drop as expected in early 2020? Only time will tell...
The total inventory continues to plummet under the burden of yet another low new listings month in the setting of recovering sales. REBGV has lost almost 2,000 inventory year-over-year despite the record breaking new project completions. The Total Inventory is now headed toward 8,500 by the end of December. Total Inventory tells only half the story but if there is a price increase next year, one could have looked at this worrisome sign as a major red flag. At any given time, sub-9,000 Total Inventory is a strong indicator of a seller's market to come.
It is now 10 months in a row of low new listings. I previously predicted the new listings to start picking up against 10-year average by this month but I am amazed at the seller resilience at this point. We are headed for decades low in annual New Listings total which will come out early next month. The kind of impact this has had on the total inventory is regrettable.
This is truly a disappointing graph. I expected the MOI to recover in November and December but strong sales continued on despite the cold weather and has kept the MOI near buyer's market level. Four days into December, it appears that the sales will remain strong again keeping the MOI between 4-5 months for the month of December.
There you have it. De-listings falling under 10-year average after staying above 10-year average for a year. This is as a result of higher than expected sales. Sales exceeded de-listings 2 months in a row which is generally an indicator of price increases to come. I am about to barf...
Subscribe to:
Posts (Atom)


