Saturday, November 28, 2020

REBGV November, 2020


Sales are staying hot in November with 5 consecutive months of 3,000+ monthly sales.  Remarkably, there were at least 700 sales every week this month without the typical weekly decline in November.  It is almost as if the buyers have not noticed that the greatest rise in Covid-19 counts and deaths are even happening this month.  We should see sales decline in December as the closure of Open House came into effect in November during this massive second wave of Covid-19 pandemic.

Total inventory is declining in a very typical pattern in November with it finishing just slightly above 11,000.  We should see a decline under 10,000 by the end of the year.  It's unclear what the new REBGV rule on expirations will have on the final annual count.  Sellers are allowed to keep their listings up during the pandemic without facing the typical rule applied to expirations.  It is likely that final TI count will fall around 9,000 in normal scenario but around 9,500 with the lenient rule in place.

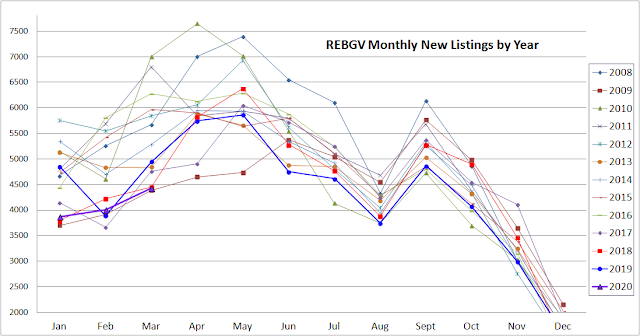
The high new listings for the last 5 months appear to have finally made up for the lack of new listings in April and May.  New listings remain higher than usual although high sales are effectively absorbing the new listings.  Despite the high new listings, there are no alarming signs of "deferral cliff" in sight and new listings appear to be shrinking to its typical level.  In December, I predict that we will see roughly 2,500-3,000 new listings.

Months of Inventory remains very much in the seller's territory.  Only has 2015 and 2017 seen hotter seller's markets than this year in the month of November.  The market is being driven by a hot detached market that is coming out of 3 years of bear market.  Year-over-year, we are likely going to see about 10% increase in the value of detached single family homes by the end of the year.


Saturday, October 24, 2020

REBGV October 2020 Projections

 
This year's October sales will smash all time October record for sales which is a very disappointing reality to many who were hoping for deferral deadlines to crush the homeowners.  It appears that many are selling and selling for profit on their investment as SAL ratio sores to record highs since 2017.  There is little doubt now how strong the sales will finish for the rest of the year.  Although sales will certainly decline month-to-month over the next 3 months, it will certainly track higher than the 10-year average.  There may be another 3,000+ sales in store in November to make it 5 consecutive months of 3,000+ sales which is a first since the foreign-buyer spree days of 2016.


Total inventory is declining toward the end of October largely due to very strong sales in October despite there being high number of new listings during the same month.  The end result is that the TI is falling in a very typical manner compared to other years while other so-called experts in CMHC predicted doom and gloom.   As you all know by now, you cannot have a doom and gloom without a SAL ratio under 10% and months of inventory (MOI) greater than 10.  Those numbers are not possible if total inventory is peaking at 13,000 for the year and falling 5% over a month.  Any small chance of a doom and gloom in 2020 has been completely eliminated.


The months of inventory (MOI) has fallen even further down in October to the lowest point since November, 2017.  This is quite concerning as the market turns to dangerous seller market territory.  Townhome SAL ratio is skyrocketing to 65% in Chilliwack, 48% in Fraser Valley territory (Abbotsford, Mission, Langley, Surrey and Delta) and 44% in REBGV.  These numbers are reminiscent of foreign buyer frenzy days except that this is being done by local buyers.  No one knew that there were enough local buyers during the pandemic as Covid-19 rages on to record high numbers this month.

MOI under 5: Seller's market
MOI 5-7.5: Balanced market
MOI >7.5: Buyer's market 


New listings continue to remain high as listers who could not list during the spring are catching up.  It has nearly all caught up by and the new listings will start to fall precipitously in November and December.  New listings will still be higher than usual compared to previous years but the month-to-month drop over the next 2 months will be very significant.


The narrative that sellers won't have the luxury to delist as they will be desperate to sell or face default on their mortgage has not been realized according to the delistings chart.  Sellers are able to delist as usual as delisting numbers continue to trend smack in the middle of this graph with appropriate month-over-month increase.  We should expect it to drop in November as it always does in November before spiking as usual in January.


Monday, September 21, 2020

REBGV: September, 2020 Projections


We are starting to see how impactful low interest rate can be when lockdown is removed during the pandemic.  Rising active Covid-19 cases in BC doesn't appear to be deterring buyers from snatching up whatever they can.  Sales are rising well beyond what was expected for September to a point where we are seeing a modern time record similar to 2009.  Interestingly, 2009 was another year of low interest rate but the major difference between 2009 and 2020 is that the housing price is about 100% more expensive now than in 2009 despite the fact that there are more than 200,000 more housing units now compared to 2009.

The way the trend appears at the moment, it will not be a surprise to see strong sales into October.  Sales over-asking or at-asking are making up 28% of all sales in September so far which is typical of seller's market.  This means about a thousand buyers or more may have missed out on the purchase due to more competitive bidders.  These unsuccessful buyers will spill over to October.  But will the increasing month-over-month property value over the last 3 months due to low MOI put a lid on the current level of sales?  Rising prices could dampen sales to some degree but price increase will likely last into the end of the year.

My October Sales Prediction: 3,100 - 3,500


As expected, new listings remain high post-lockdown.  However, year-to-date new listings remain abysmally low at a 10-year-low whereas year-to-date sales in 2020 have already surpassed 2012, 2019 and 2020 year-to-date sales.

There were roughly 6,000 new listings that were compromised during the spring season due to covid-19 pandemic (1,000 in March, 3,000 in April and 2,000 in May).  We have now gotten back about 4,500 of them back on the market since June (500 in June, 1,000 in July, 1,500 in August and 1,500 in September). There remains another 1,500 to return to the market assuming that all of them are returning to the market.  Of course, there is no guarantee that all of them will be back but that may be balanced out by listings that will come on the market as a result of difficulties caused by Covid-19.  Thus, I still expect that there will be high New Listings in October.

My October New Listings prediction: 5,000 - 5,500


Total inventory rise is starting to slow down.  While it was going up by +600 in July and August, it is anticipated to go up by just 300 to 400 this month.  We are nearing parity with last year's inventory level and we are likely to see October's total inventory finally reach positive year-over-year change.  However, I anticipate that total inventory will finally drop month-over-month in October to halt a 5 consecutive month of rising inventory.


Months of Inventory is well in the seller's market for 4 consecutive months leading to ongoing housing price increase.  This kind of MOI in September has only been beaten by foreign-buyer frenzy days of 2015 and 2017.  

My October MOI Projections: 3.5 - 4.5


De-listings are rising against all odds in September.  Anticipation was that desperate homeowners facing imminent mortgage defaults in October won't be able to delist in September and will be force to keep their listing on the market.  However, the current rise in de-listings is quite typical for the month of September.  This speaks to the holding power of homeowners at this time.  I expect de-listings to stay in the middle of the chart moreorless for the rest of the year.

My October Delisting Projections: 2,400 - 2,800

Thursday, August 20, 2020

REBGV August 2020 Projections


August sales will be right along the same line as July in the ballpark of 3,000 sales.  As August had 2 less business days than July, sales will look slightly less in August but the average daily sales have been actually higher in August.  So far, average sales per day in August is 151 sales per day whereas average sales per day in July is 142 sales per day.  September brings another intriguing month.  There have been record breaking new listings in August and we anticipate to see some of those translate into sales in September.  Don't be surprised to see another 2,800 to 3,200 sales month in September for 3 consecutive months.

Months of Inventory (inverse of SAL ratio) is remaining in the seller's market territory for August due to high sales.  One should expect high sales and high new listings again for September with both numbers being well over 10-year averages.  Both numbers being high should cancel each other's effect Months of Inventory keeping it level.  One should expect similar findings in September where Months of Inventory should remain between 4.2 to 5.0.

MOI under 5 = Seller's Market
MOI 5 to 7.5 = Balanced Market
MOI over 7.5 = Buyer's Market


Typical spring season TI increase was halted by Covid-19 pandemic this year.  One should remember that high transactions lead to TI increase and low transactions lead to TI decrease.  This is why we always see TI increase during spring and TI decrease during winter.

High sales/High New Listings during Spring = TI generally increases
Low sales/Low New Listings during Winter = TI generally decreases

Therefore, it is absolutely not a surprise at all that we are seeing TI increase right now as both sales and new listings are high.  What is more important is what kind of impact this volume will have on the SAL ratio.  And currently, SAL ratio continues to remain in the seller's territory.


There were roughly 6,000 new listings that were compromised during the spring season due to Covid-19 pandemic (1,000 in March, 3,000 in April and 2,000 in May).  We have now gotten back about 3,000 of them back on the market since June (500 in June, 1,000 in July and 1,500 in August).  There remains another 3,000 to return to the market assuming that all of them are returning to the market.  Of course, there is no guarantee that all of them will be back but that may be balanced out by listings that will come on the market as a result of difficulties caused by Covid-19.  

There is little doubt that New Listings will be high in September.  We may see new listings like we've never seen before.  Out of 3,000 listings that has yet to return to the market, we could see 1,500 to 2,000 of them return in September in addition to typical 10-year-average for September.  This means that we could see New Listings as high as 6,500 to 7,000.  This will certainly have a positive impact on Total Inventory but the degree of TI increase will depend on how high sales will be in September.

September Predictions:
Sales: 2,700 to 3,100
New Listings: 6,500 to 7,000
Expirations: 2,200 to 2,500
Total Inventory Change: +1,200 to +1,800

Friday, July 17, 2020

REBGV July, 2020 Projections


Sales rose to pre-pandemic levels in June and is on track to explode in July to levels that were only seen during the foreign buyer buying frenzy days of the past.  Very few could have seen that sales would explode so soon even prior to the Open Houses being resumed in Lower Mainlands.  And now that the Open Houses have started again this past weekend, we can only expect the sales to at least be maintained at this level for at least another month.  The real concern right now is if the sales are rather too high.  If sales remain over 2,000 in August, that is 3 consecutive months of SAL ratio > 20%.  This is alarming as SAL ratio > 20% for 3 consecutive months is exactly when the housing prices start to increase.

My July Sales Projection: 2,900 - 3,100
My August Sales Prediction:2,500 - 2,800


New listings returned to above 10-year-average for June and will remain this way in July which is not  by any means a surprise as many of the listings that weren't listed in March, April and May are finally entering the market.  New Listings in August will break all kinds of record highs as this year's August will not be a typical "Holiday month" due to Covid-19.  However, we should see month-over-month drop in New listings from July to August.

My July New Listings Projection: 5,700 - 5,900
My August New Listings Prediction: 4,800 - 5,100


High new listings have added much needed inventory to the market that took a dive during the latter half of 2019 and remained low through the pandemic.  However, it remains woefully low in comparison to last year's numbers.  And there is no evidence that "buyer's market"-like Total Inventory levels are possible this year.  Total Inventory should remain stable in August, rise in September and fall off during the winter.

My July TI Projection: 11,900 - 12,100
My August TI Prediction: 11,800 - 12,200


Months of Inventory has fallen to 5 and is headed dangerously low under 4.  We are now at a point where one additional month of MOI < 5 months (SAL ratio > 20%) will cause upward pressure on prices.  There are already part of the market such as entry-level detached and attached properties (townhomes, etc) going into multiple offer situations and over-assessed sales.  As you can see from the chart, Covid-19 has essentially stopped what was clearly going to be a seller's market this spring but it doesn't appear to have been enough to stop it completely for the year.  Grab your popcorns.  This should be an interesting August and September coming up.

My July MOI Projection: 4.0
My August MOI Prediction: 4.3 - 5.0


Thursday, June 18, 2020

REBGV June, 2020 Projections


Sales are returning out of the gates of Phase 2 re-opening in BC.  Although sales were expected to return, not many expected such an early increase in sales given that Open Houses are still not being done.  June's total will surpass last year's sales number.  Given the circumstances of 2020, this is a surprise to many.  Sales are expected to return to stable month-over-month figures next month as many buyers that sat the spring market during the lockdown return to market.


Inventory is starting to come back online in Phase 2 to make up for the losses taken during March to May.  It still sits below 2018 and 2019 numbers for now but it should increase well into September this year as more sellers return.


New Listings are coming back with a force in June.  It is estimated that roughly 5,000 new listings may have been compromised during the Covid-19 pandemic.  It appears that about 1,000 of them are now back on the market leaving about 3,000-4,000 additional new listings that will be topped up in addition to typical monthly totals over the new few months.  One can expect a fairly high New Listings number for July and August as New Listings play catch up.


Month of Inventory is starting to return to seller's market territory with MOI expected to fall under 5. It may be too early to tell for now but it is a must-follow trend of 2020 with Covid-19 still looming in our society.


Friday, May 8, 2020

REBGV: April 2020


The sales dropped to the lowest level since 1982.  Covid-19 has effectively suspended what was surely a seller's market leading into spring.  We should expect to see much of the same in May as social distancing rules have effectively ended Open Houses across Lower Mainlands and the rest of the country.  One can expect the sales to remain slumped in May while New Listings slowly start to pick up.

My prediction for sales in May, 2020: 1,100-1,400


New listings took a major dive in May as Open Houses was essentially banned due to Covid-19.  There are now rumours regarding whether Open Houses can resume as BC starts to ease restrictions on social distancing.  When Open Houses are officially back on (which could happen in May), we should expect to see some flooding of new listings.  Of course, increase in sales will follow this with about a 3-week delay.  Thus, I don't expect to see any spike in Sales in May but we may perhaps see it in June.

My prediction for New Listings in May, 2020: 3,400-3,800


The overall impact of record low Sales and New Listings in REBGV has in fact had a negative impact on Total Inventory much to the chagrin of many buyers out there.  Rather than leading to explosion of inventory, there is still not enough competition for sellers out there for there to be panic selling.  This is the first time that we have seen a negative month-over-month change in Total Inventory since 2009.  What is more impressive about this achievement this year is that the TI is already at a low level under 10k.  In fact, we are now under the TI level of April, 2018.  This is despite the fact that there has been record number of housing completions in Greater Vancouver over the last 2 years.  The buyers will want to see TI rise back up above 10k in May which is possible if Open Houses return this month.

My prediction for TI in May, 2020: 9,900-10,200


De-listings dropped slightly in April which is a bit of a surprise given the current pandemic.  Most listers have chosen to keep their homes on the market rather than taking it off during the pandemic.  This makes the negative month-over-month changes in Total Inventory even stranger.  If many more chose to de-list, total inventory could have dropped even more.  But this also means that many of the upcoming New Listings may not be so much Re-listings but rather true New Listings.

My prediction for de-listings in May: 1,600-1,900

Saturday, April 18, 2020

REBGV: April, 2020 Projections


Due to the Covid-19 pandemic, sales will collapse to the lowest seen in decades and is roughly estimated to end somewhere in the 1200-1400 range.  This will bring the SAL ratio to the balanced territory.  As stated in my last edition, low transaction (low sales and low new listing) months don't lead to significant changes in prices particularly with SAL ratio in the Balanced territory.  We see this every December which has no impact on the spring market.  We will need to wait until social distancing rules are reduced to see which direction the market is headed.  Given that BC is effectively flattening the Covid-19 curve thus far, we could see businesses re-open gradually starting in May as John Horgan, Adrian Dix and Dr. Bonnie Henry suggested today.  Low sales are expected to extend into May due to Covid-19 before we start to see a slight month-to-month gain through the summer.


Total inventory will fail to increase month-to-month for the first time since 2009.  This is due to unprecedented low new listings we are seeing this month due to Covid-19.  We should see TI continue to struggle for May.  As long as TI remains under 12,000, the hope of a massive decline in benchmark pricing in 2020 is out the door.  Bears will want to see at least a 1,500 TI increase month-to-month to get to 12,000 or higher as fast as possible before the winter arrives.


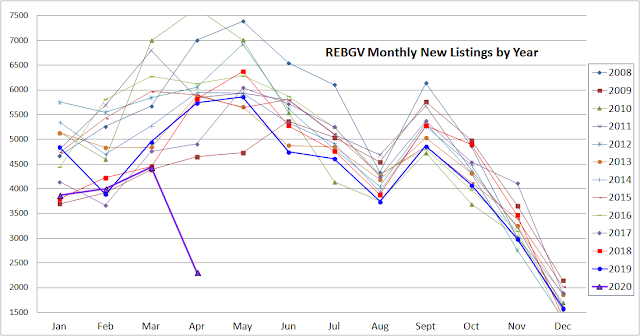
We are seeing something here that we will likely never see again.  New listings falling off the cliff like we have never imagined.  The chart says it all right here and there is nothing more to be said.


Wednesday, April 1, 2020

REBGV: March 2020


I would like to start off by wishing everyone well during these tough times.  Stay safe and stay home! I would also like to thank our health care workers during this tough time who risk their lives everyday to keep us all safe!


As you are all well aware, we are now entering into a period in real estate market that won't be mirrored by any stats in recent times.  The initial March sales data was strong with total sales heading toward 3,000+ for the month of March with a SAL ratio of whopping 30%.  But the sales have been halted in the latter half of the month as social distancing measures closed down open houses and hindered real estate transactions.  With the government reporting that the current social distancing measures will carry on for the entire month of April, we should see a jaw-dropping drop in sales to about 1,000-1,300 in April.


Growth in total inventory was also halted by the Covid-19 pandemic with TI actually trending negative during the latter half of March.  This trend should continue into April and we could be seeing TI under 9,000 by the end of April.  We are very likely to see a month-to-month Total Inventory decline in April for the first time in 11 years with TI falling dangerously low.  With realtors reporting that up to 50-70% of current inventory not being viewable at this time due to the fear of Covid-19 spread, it is quite possible that the current true available TI count may be much lower under 5,000 which is unimaginably low for a population of 1.7 million+ in the REBGV territory.


New Listings were heading for high 4,000s in the first half of April but they have significantly dropped off as sellers are unable to hold open houses.  I also suspect that there are many sellers who don't want visitors entering their homes during the Covid-19 pandemic.  This has led to a significant drop off in New Listings which is exacerbating what has already been a low New Listings streak that has lasted for over a year.  We are going to see all kinds of records being broken in the upcoming April in terms of Sales and New Listings but I suspect that nothing will be as impressive as the drop in New Listings in the upcoming month.  It will likely be off-the-chart at around 2,500-3,500.


With so much going on right now with both sales and new listings plummeting, it may make more sense to look at the MOI rather than the individual sales and new listings data.  MOI has finally crossed that line under 4.  However, this will be very short-lived as sales will plummet in April due to Covid-19.  We will see a significant bounce up in MOI in April well within the balanced territory.

Having said the above, I don't believe that MOI can be interpreted to say that either the seller or the buyer has an advantage at this time.  Low transaction periods are tricky and the current pandemic situation is even more complex.  We see low transaction in December every year and the MOI in December is hardly useful in telling us what kind of market we are likely headed for in the spring time.

What we do know is that the market was certainly headed toward the seller's market prior to the pandemic.  As to whether this will resume when the world begins to turn again is anybody's guess at this point.  A bear can point to permanent job losses, business closures and bankruptcies but a bull can point to cheap mortgage and delay in housing constructions which is already trailing behind GVA population increase.

MOI 1-4 months: Seller's Market
MOI 4-5 months: Seller's Market (but price increase expected to be similar to annual inflation)
MOI 5-7.5 months: Balanced Market
MOI > 7.5 months: Buyer's Market


De-listing data is staying below 10-year average and will remain low in upcoming April due to the sheer lack of inventory in the market right now.  The DEAL Ratio (Delisting/Expiration to Active Listing Ratio) is typically around 11-15% in April so we should see expirations around 1,100-1,500 this month.

Friday, March 6, 2020

REBGV: February, 2020


February sales finished roughly 15-16% under the 10-year-average and finished under the 2018 levels.  I anticipate that this is the beginning of a possible storm ahead.  Mortgage stress tests have been loosened and the Bank of Canada has cut down on the interest rate by 0.5% just 2 days ago.  This is the first rate cut since 2015 when it caused a significant housing boom.  Interest rate cut has consistently led to big housing booms in the last 20 years and this will certainly cause another housing boom in Vancouver.  Sales watch has never become more interesting now over the next several months.


Total Inventory struggled to rise during the first half of February but it started to pick up during the latter half rising over the 9,000 mark to finish the month.  It is widely anticipated that the TI will cross over 10,000 in March, 2020 which is a welcoming sign for buyers looking for options.  But with over-ask and at-ask sales increasing in frequency, deals are becoming harder to find across REBGV.


New Listings finished low again for 4 years in a row for the month of February.  You will see from the chart above that the 4 lowest data points are in fact 2017, 2018, 2019 and 2020.  When will we start to see some New Listings?  The good sign right now is that the New Listings picked up during the last week of February and the first week of March so far has been very strong.  So it finally appears that we will see some New Listings in March.  Stay tuned...


MOI has dropped to 4.5 as expected for the month of February.  MOI is anticipated to drop in March which means that the market will fall further in seller's market.  It appears increasingly more likely that 2020 will be a seller's market as government policies (loosening of the mortgage stress test followed by the interest rate decrease) take into effect.  The next question now appears to be just how much of a price increase will we see in this year's market?

MOI 0-4 months: Seller's Market
MOI 4-5 months: Seller's Market (but price increase expected to be similar to annual inflation)
MOI 5-7.5 months: Balanced Market
MOI > 7.5 months: Buyer's Market

Thursday, February 13, 2020

February 2020 Projections


Sales appear to be on track to finish under 10-year average in February but it will finish way over last year's low.  You can argue this one either way.  It is good to be under 10-year-average but it is not good that it has increased so much year-over-year.  But there is no doubt that a big player in this month's sales have been the historically low New Listings this month which I will discuss further below.


Inventory is struggling to rise in February.  It has yet to surpass January 31st sales as of today.  Although it should rise eventually towards the end of February, the damage has already been done for this month.  This was an opportunity lost to see a major rise in TI this year.  This increases the probability of "TI flatline" that we saw in year 2013 from February to June.  If TI flatlines, it will be devastating for buyers as the starting point for TI is lower this year than in 2013.


This is the news of the year so far just like in 2019.  We are starting 2020 at levels under any other year in recent times.  Let's not forget that year 2019 was the lowest new listings year we've had in the longest time.  When will the sellers return to the market?  We've been waiting for this all of last year and now the first 2 months of this year.  If it must happen, it should happen March to May when New Listings hit the peak season.  Time to grab the popcorn.


De-listings are slowly starting to decline against the 10-year average which is typical for a seller's market.  As you can see on the chart above, 2009, 2015, 2016 and 2017 had very low de-listings.  We can expect the de-listings to remain low for the next couple months.  This is because we have so few Total Inventory to begin with while the SAL ratio remains high.  This is the right cocktail for low-delistings.


It's hard to see this year's MOI trend if you can find it.  The reason why it's hard to look at is because this year's trend so far is nearly identical to 2 other years: 2011 and 2015.  This 3 lines nearly overlap each other.  One can recall that 2011 was a balanced year and 2015 was a seller's market.  With MOI nearly guaranteed to drop month-over-month in March, we should be well within the seller's market in March.

MOI 0-4 months: Seller's Market
MOI 4-5 months: Seller's Market (but price increase expected to be similar to annual inflation)
MOI 5-7.5 months: Balanced Market
MOI > 7.5 months: Buyer's Market


Thursday, January 2, 2020


Sales in December finished strong and reared its head above the 10-year average for 3 months in a row.  There were some fluctuations along the way month-to-month in 2019 but the general trend is now obvious.  The buyers are more satisfied with the pricing of today's market.  There is no sign that the sales are about to struggle in Jan-Feb, 2020 like it did in Jan-Feb, 2019.  Weak Jan-Feb sales are consistently followed by a weak Nov-Dec sales from the previous year.  As such, you can anticipate that the sales will remain at 10-year-average or above during the next 2 months.

The big question to be answered in January is whether Canada's interest rate will drop a quarter percentage.  Should this occur, it will have a significant impact on sales.


Months of Inventory will decline in December month-over-month as it inches closer to sellers' market.  The lower MOI is mostly driven by popular condo sales in REBGV which is now showcasing a SAL ratio of 32%.  We have seen lower MOIs in December in 4 other years: 2009, 2015, 2016 and 2017.  All 4 of those years were entrenched in a very strong sellers' market.  If the MOI drops below 4 in January or February, any hope of further decline in prices in the new year will be completely dashed.

MOI under 4 = Seller's Market
MOI 4-7 months = Balanced Market
MOI over 7 = Buyer's Market


Total Inventory took an unexpected fall in 2019 and took rather a large drop again in December.  The low new listings played a significant role in this year's inventory drop.  We can anticipate the TI at the end of January, 2020 to be around 9,000-10,000.